Welcome!
Exploring Michigan’s Ecosystems, Past and Present
Presented as an alternative to a PowerPoint presentation, we (Myles Walimaa and Randy Swaty) hope to orient you to Michigan’s ecosystems as they were just prior to European Colonization and as of ~2020. This can certainly be built upon and these workflows may be used for any area of interest. The State of Michigan is the target area for this dashboard, since it is where both Randy and I have lived for years.
Randy is an ecologist for The Nature Conservancy and I am a former National Park Service employee. We both work with the Conservation Data Lab to mentor students in the art of computer coding and data visualization, particularly for conservation purposes.
For all charts:
The acreages were calculated based on the quantity of 900m2 pixels (30m x 30m), which was converted to acres.
Use your mouse to zoom in on smaller areas by drawing a box.
You can reset the zoom by clicking the “house” icon at the top left of the chart.
PLEASE read the disclaimers on each slide explaining the assumptions with each dataset. This is meant for exploratory purposes only.
The Past
Observations and the dataset
Historically, Michigan was dominated by hardwood-dominated ecosystems, with a substantial showing of wetland (refered to as “riparian” in the source data set) conifer and mixed hardwood-conifer types.
This map was created using LANDFIRE’s Biophysical Settings. As there was no satellite imagery 300 years ago, this is a model of what the historical ecosystems looked like based soil types, climate, elevation, ecological succession, among many other datasets. The original data displayed plots of 30m x 30m squares that we call “pixels”, and Michigan has over 500 million of them!
This is what we think the distribution of ecosystems looked like prior to European settlement. The caretakers of this land at the time were the indigenous natives who called the Great Lakes their home. They recognized the value of fire for regeneration and resiliency, often performing “prescribed” burns to keep their home strong and healthy.
Explore this map created by Native Land Digital to learn more about which tribes were located where. Botanist Robin Wall Kimmerer’s book Braiding Sweetgrass provides valuable insight on the traditional ways the natives connected with the land.
DISCLAIMER:
This was intentionally non-interactive simply to give you a broad visual of what things probably looked like.
Download map of coarse historical ecosystems here
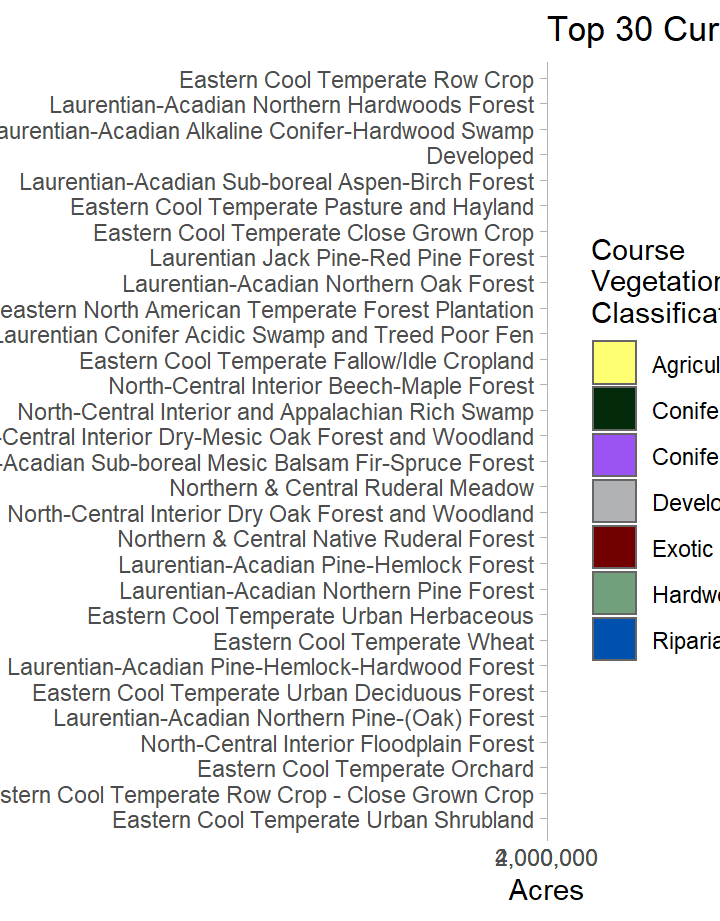
Present
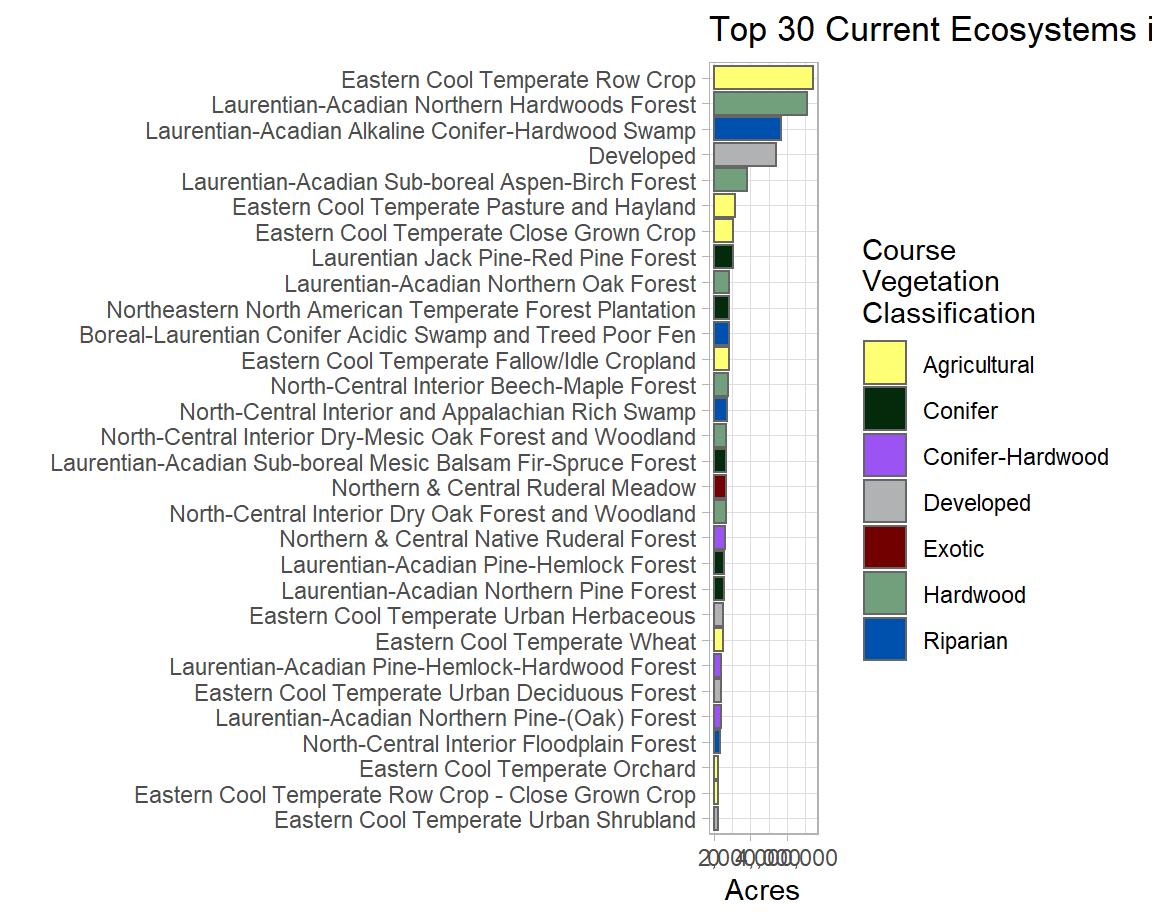
Observations and the dataset
This chart was created using LANDFIRE’s Existing Vegetation Type. This uses satellite imagery, ground assessment, and other methods to describe current “ecosystems” (or lack thereof). The main pattern to note is the substantial amount of agricultural types on the landscape today.
Existing Vegetation Type (EVT) has a “fine” scale classification called “EVT_NAME” and a “coarse” scale classification called “EVT_PHYS”. The map and the chart are based on “EVT_PHYS”
Does anything jump out to you as surprising?
What do you notice about the historical and current ratios of conifers-to-hardwoods?
DISCLAIMER:
Again, this is not a perfect representation of today’s conditions and is meant for scales of several thousand+ acres. If you want to explore the EVT dataset further, you can find information here and can read about its development. There is a nifty handbook that discusses each ecosystem classification in a fair amount of depth, so you may get a better idea of what you may find there.
I grouped all the developed sub-categories into a single “Developed” classification.
Download a map of the coarse present ecosystems here
Exploring Change
Observations and the dataset
This chart allows us to explore conversion of the historical ecosystems to 4 ‘novel’ land cover types:
- Agricultural
- Developed
- Other, such as mining or influx of non-native species.
- NatVeg. This indicates no change, or when a historical ecosystem has changed to different historical ecosystem. For example a patch of ground (acres are the units) that was “Laurentian-Acadian Northern Hardwoods” historically, and “Boreal White Spruce Hardwoods” today.
Which ecosystems remain mostly the same? Is this surprising?
Where did most of the agricultural land come from? Do you notice any trends?
Are there any ecosystems that might be close to disappearing completely?
DISCLAIMER: Changes may be due to ‘real’ changes on the ground, or may be due to differences in mapping methods between the past and present datasets.
The map only depicts Agricultural and Developed land cover types. Map may be downloaded here
Coarse Look at Conversion
Observations and the dataset
This interactive chart shows us the flow of ecosystem conversion over broad land cover types.
- The left side shows coarse landcover from the past (BPS), and the right shows current landcover (EVT)
- The grey bands represent transitions from one to another
- When you hover, the number value is in acres (approx)
Which ecosystems had the least amount of conversion?
What about the most? Where did they go? How many acres were converted?
Why did so little Agricultural land come from Coniferous ecosystems?
DISCLAIMER: Changes may be due to ‘real’ changes on the ground, or may be due to differences in mapping methods between the past and present datasets.
Fine Look at Conversion
Observations and the dataset
This is the data table that created the previous chart. Here you can see in detail how the ecosystems converted.
There are over 2000 comparisons over 152 pages
The left side shows landcover from the past (BPS), and the right shows current landcover (EVT)
The number value in acres is approximate
Clicking on a column name will organize the data in ascending or descending order
You may use the search bar in the upper-right to filter the data by keywords
To download the file, there are CSV and Excel buttons in the upper-left corner
For example, 429,625 acres of North-Central Oak Barrens are now Eastern Cool Temperate Row Crop. Well, roughly.
Again, this is not a perfect comparison and is only intended on giving you a general idea of what’s going on.
ENJOY AND HAVE FUN!!
DISCLAIMER: Changes may be due to ‘real’ changes on the ground, or may be due to differences in mapping methods between the past and present datasets.